

*The following analysis is based on a review of Harbor Star’s annual reports and press reports. We have not previously analyzed this company and do not hold any positions in its stock. This assessment does not consider any information provided in Harbor Star’s most recent quarterly report, which was released on 15 May 2017. Readers should not make any investment decisions based on the following report and should understand our target price is a byproduct of our analysis, assumptions, and valuation approach, which could be flawed.
Company: Harbor Star Shipping Services, Incorporated
Industry: Transportation Services
Headquarters: Manila, Philippines
Exchange: Philippine Stock Exchange
Symbol: TUGS
Price per share (Philippine Peso, PHP): 2.89
Price per share (US Dollar, USD): 0.0578 [1]
Shares outstanding: 605,238,580
Market capitalization: PHP 1,749,139,496
Target price: PHP 4.54
*Data is of 22 May 2017
OVERVIEW
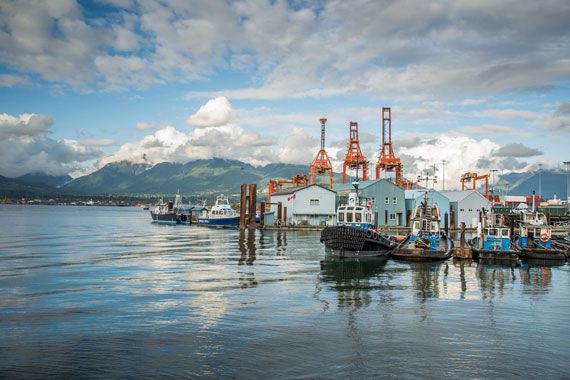
Harbor Star Shipping Services is a tugboat operator headquartered in Manila, Philippines. The company was founded in 1998 and is a market leader in harbor assistance, towing, lighterage, salvage, maintenance, and construction services. It has a fleet of 42 watercraft comprised of tugboats, barges, and specialized vessels that it operates at 67 Philippine ports and sub-ports. Increasingly, the company also is expanding into Southeast Asia, with signed or pending agreements to operate in Indonesia, Malaysia, and Myanmar, and it is pursuing business opportunities outside its core maritime function.
Harbor Star was a private company from 1998 until late 2013, at which point it began trading on the Philippine Stock Exchange (PSE), under the symbol “TUGS.” In its 2016 fiscal year, which runs concurrently with the calendar year, the company earned a total comprehensive income of PHP 105 million, or USD 2.1 million, on PHP 1.3 billion in revenue, or USD 26 million. This represents approximately an eight percent income to revenue margin.
In March 2017, shareholders approved management’s proposal for a stock dividend of 302,619,290 shares, representing 50% of the company’s current outstanding shares of 605,238,580 shares. The Philippine Securities and Exchange Commission will set the record date for this dividend and the shares will be listed on the PSE. In 2015, the company paid a dividend of PHP 0.038 per share, and in 2014 and 2013, it paid a dividend of PHP 0.035 per share, according to the company’s 2016 annual report.
BOARD OF DIRECTORS AND MANAGEMENT
Harbor Star has seven board members, whose starting dates range from 2000 to 2012. The Chief Executive of the Company, Geronimo P. Bella, Jr., also is the Chairman of the Board, which could limit the board’s independence. Only two of the board’s seven directors are independent, which meets Philippine legal requirements but falls short of the Philippine Stock Exchange’s guideline that at least three board members, or 30%, whichever is greater, be independent, according to Harbor Star’s corporate governance filing. Most board members have experience in the shipping industry.
The total non-stock compensation awarded in 2016 to five Harbor Star executives, to include the CEO and Vice President, was PHP 26,614,242, or approximately USD 532,284, which implies an average of USD 106,000 per executive. The CEO and Vice President also own 40.3% and 26.6% of the company’s outstanding shares; all remaining management and directors each own less than 1% of the company’s outstanding shares, according to its 2016 annual report. The significant portion of shares owned by the CEO and Vice President, coupled with their relatively modest non-stock compensation, suggests their interests generally align with shareholders.
The compensation committee is chaired by an independent director and consists of the CEO and an external director. The audit and risk committee is chaired by an independent director who has a degree in accounting but has held few accounting-specific positions, based on a review of Harbor Star’s 2016 annual report. The audit and risk committee also consists of an executive director and external director. Although the composition of these committees complies with the company’s manual on corporate governance, it would not comply with the policies of the New York Stock Exchange, which require the compensation and audit committees consist only of independent directors.
INDUSTRY AND COMPETITION
In the Philippines, a nation of over 7,000 islands, Harbor Star is a leading tugboat service provider—most are small companies with only a few vessels and service offerings—and the only tugboat company that is publicly traded. As of August 2016, there were 209 tugboats in the Philippines with over 100 gross register tonnage (GRT), according to HIS Fairplay Sea-web, as reported by Marcon International. As of 28 April,[2] 35 of Harbor Star’s Philippines-based 40 tugboats had a GRT greater than 100, suggesting Harbor Star commanded 17% of the local tugboat market.
Regionally, there are dozens of tugboat operators, most of which are private companies with only a few vessels, but there also are larger companies that offer similar services and have comparable fleets to Harbor Star. The following chart identifies the number of tugboats that exceed 100 GRT in select Southeast Asian countries, as well as their average age. As of August 2016, these six countries—Indonesia, Malaysia, the Philippines, Singapore, Thailand, and Vietnam—had over 5,500 tugboats flagged in their waters, suggesting Harbor Star faces many potential competitors in the region.
Tugboats in Southeast Asia Exceeding 100 GRT, Flagged by Country, 2011-2016
INDONESIA |
MALAYSIA |
PHILIPPINES |
SINGAPORE |
THAILAND |
VIETNAM |
|||||||
DATE |
Tugs |
Age |
Tugs |
Age |
Tugs |
Age |
Tugs |
Age |
Tugs |
Age |
Tugs |
Age |
Aug’16 |
3,859 |
2007 |
522 |
2004 |
209 |
1980 |
687 |
2009 |
118 |
1986 |
147 |
2001 |
Nov’15 |
4,417 |
2002 |
516 |
2001 |
206 |
1978 |
715 |
2006 |
112 |
1983 |
139 |
1998 |
May’14 |
3,672 |
2002 |
496 |
2002 |
183 |
1978 |
688 |
2006 |
110 |
1984 |
123 |
1997 |
Nov’13 |
3,475 |
2002 |
493 |
2003 |
182 |
1979 |
644 |
2006 |
109 |
1985 |
108 |
1997 |
Aug’12 |
2,913 |
2001 |
465 |
2002 |
162 |
1977 |
677 |
2006 |
106 |
1983 |
99 |
1996 |
Nov’11 |
2,490 |
1999 |
491 |
2002 |
153 |
1976 |
732 |
2006 |
109 |
1982 |
95 |
1995 |
*Data is sourced from Marcon International, which obtained the data from HIS Fairplay Sea-web. “Age” represents the average age of each country’s tugboat vessel as of each respective year.
COMPETITIVE ADVANTAGE
The size of Harbor Star’s fleet, the breadth of its offerings, and its presence throughout the Philippines allow it to scale its business and position itself as the country’s premier harbor-assistance provider, as well as compete regionally. Harbor Star also is the only integrated management system-certified tugboat provider in the Philippines, according to its 2016 annual report, underscoring its commitment to enhancing performance and further differentiating the company from its competitors.
Harbor Star’s employees are not unionized and there are no existing collective bargaining agreements, according to the company’s 2016 annual report, which could provide an advantage over local and regional competitors because it will reduce the chance of labor interruptions. This almost certainly is an important consideration for shipping companies and ports because past tugboat labor strikes have disrupted operations, as reported by The Sydney Morning Herald and the Australian Broadcasting Corporation.
Harbor Star can access equity markets to raise capital to expand its operations, a benefit no other Philippine-based harbor assistance provider can leverage. This provides Harbor Star funding streams unavailable to its competitors that it can use to help grow its business and take increased market share.
Finally, Philippine law disallows foreign marine firms from operating at ports that local companies can service, providing Harbor Star a layer of insulation from increased competition. To maintain this protection, the company cofounded the Harbor Tugowners Association of the Philippines, according to Harbor Star’s 2016 annual report, which it uses to advance this and other interests.
SHARE PERFORMANCE
Harbor Star’s stock price has appreciated 78% from its initial trade date on 30 October 2013 through 2 May 2017. Despite this approximately 17.9% compound annual return, the stock until recently had traded below its initial public offering and, in January 2016, had plummeted to PHP 1.08 per share, representing a decline of 43% from its initial public offering. In August 2016, however, the company reported a 315% increase in net income from the prior period, according to the company’s press page, which helped the stock climb more than 50% that month alone. Since then, the share price generally has maintained this upward trajectory, although as of 2 May 2017 it traded approximately 20% below its high in February of PHP 4.03 per share.
The following chart captures the percent return from 31 October 2013 through 28 April 2017 of Harbor Star and three other Southeast Asia-based tugboat operators that are publicly traded: Malaysia’s Harbour-Link and Singapore’s Marco Polo and Tiong Woon. Of these four companies, Malaysia’s Harbour-Link has provided the greatest return, followed by Harbor Star; both Marco Polo and Tiong Woon have yielded negative returns.
[wpdatachart id=24]
GROWTH CATALYSTS
The prospects for improved growth globally, in Southeast Asia, and in the Philippines—despite fears of creeping protectionism—should provide a catalyst to trade and shipping, which should result in greater demand for tugboat operators. Harbor Star’s expansion throughout Southeast Asia, coupled with new growth opportunities in the Philippines stemming from infrastructure development, also should enhance revenue growth.
Improving global, regional, and national growth will drive greater demand for tug services
The global economy continues to improve, albeit slowly, and this expansion should lead to increased trade. In April, the IMF forecasted global growth to expand from 3.5% in 2017 to 3.8% in 2022, compared with an average annual growth rate of 4.2% from 1999-2008.
Regionally, the Asia-Pacific region is expected to grow 5.5% in 2017 and 5.4% in 2018, according to the IMF, and intra-Asia trade should increase as these governments continually work to integrate their economies and reduce market frictions. The Philippines already has individual trade agreements with members of the Association of Southeast Asian Nations (ASEAN), Australia, China, India, Japan, New Zealand, and South Korea, according to the Philippine Department of Trade and Industry, and it is party to the Regional Comprehensive Economic Partnership (RCEP), a proposed free trade agreement between ASEAN states and six other Asian nations.
Finally, the Philippines is one of the fastest growing economies in Asia—the IMF estimates its GDP will expand 6.8% in 2017 and 6.9% in 2018, according to the Philippine Star—and the current administration is embarking on several policies expected to accelerate this growth. In mid-May, the country reported first quarter GDP growth of 6.4%, according to Business World, a Philippine business publication.
Regional expansion provides opportunity to broaden revenue base
Harbor Star actively is expanding its tugboat services across Southeast Asia, which will diversify its revenue streams and should lead to increased profitability, particularly as regional economies grow and increase trade. In March, Harbor Star announced an agreement with the Myanmar Port Authority to provide tugboats to service an oil tank farm and was finalizing an agreement with Indonesia’s state-run oil company Pertamina. In 2016, it signed a two-year charter to provide harbor support services in the Malacca Strait, according to Baird Maritime.
Philippine infrastructure projects lead to new opportunities and increased growth
Manila is embarking on an ambitious infrastructure plan—spending approximately PHP 9 trillion, or USD 180 billion, over the next five years—to build roads and railways, along with other infrastructure improvements, according to the Philippine Daily Inquirer. We assess increased infrastructure spending will spur increased trade and shipping activity, which will benefit Harbor Star. This benefit should outweigh any decline in intra-Philippine sea shipments that result from the decreased travel times in land transport.
Opportunities to use shipping to alleviate street traffic congestion, particularly near Manila, also will provide new demand for Harbor Star’s services. Philippine port operator International Container Terminal Services is building the Philippines’ first barge terminal to move freight from the Port of Manila to nearby Cavite—an initiative to mitigate traffic-induced delays at the port—and will use Harbor Star to service the new terminal, according to the Philippine Star. Harbor Star may provide a similar service at the Port of Cebu and Port of Bataan, according to the Manila Standard.
RISKS
Harbor Star’s primary risks stem from fuel and wage costs—its two greatest cash expenses from 2012 through 2016—and various unique risks associated with its diversification and expansion efforts; the company’s diversification efforts probably stem, at least in part, from CEO Geronimo Bella, Jr.’s, comment in March that the Philippines presented few growth opportunities, according to Business Mirror, a Philippine business paper publication.[3] Harbor Star’s ability to navigate these risks will have a lasting impact on the company’s profitability.
Rise in fuel costs and international demand for Philippine seafarers pressure profit margins
An increase in fuel costs would significantly impact the company’s profit margin and net income. From 2012 to 2016, fuel expense and lubricants comprised, on average, 22% of the company’s cost of sales, making it the company’s greatest expense after depreciation, according to a review of its annual reports.
Global demand for Philippine seafarers could pressure Harbor Star to increase wages, which accounted for 19% of its expenses from 2012 through 2016, behind only depreciation and fuel. Internationally, the Philippines supplies the largest number of non-officer seafarers, and it provides the second greatest amount of officers, behind China, according to the International Chamber of Shipping. Foreign shipping companies prefer to hire Filipinos because of their training and proficiency in English, according to the Philippine Department of Labor and Employment, as reported in the Manila Times.
Harbor Star’s diversification efforts raise operational and financial concerns
Harbor Star’s desire to diversify revenue streams could lead it to undertake projects that deviate from its core business and expertise, thus reducing the probability these initiatives would be successful. For instance, as of mid-2017, the company was seeking to develop a solar power harvesting facility that would generate between 25 and 275 megawatts of power, according to the Manila Bulletin. Details regarding this effort are sparse—Harbor Star’s CEO and board chairman stated in early March the company could not divulge details of the project, according to the minutes from a special meeting of stockholders—and It is unclear whether Harbor Star’s traditional business lines have any linkage to this proposal. There is no information to suggest the company’s senior management or board members have experience in renewable or conventional energy.
Harbor Star’s foray into the renewable energy field, as well as the expansion of its traditional business lines, will need to be financed with new debt and equity, suggesting management must judiciously navigate these ventures not only to ensure they are accretive to earnings, but to ensure they do not jeopardize the company’s solvency. In March, shareholders approved management’s proposal to raise as much as PHP 1 billion, or USD 20 million, through new share issuances, according to the minutes from a special meeting of stockholders. A share offering of this size represents approximately 50% of Harbor Star’s market capitalization as of 8 May,[4] which significantly dilutes shareholders’ ownership and suggests the company’s management believed its shares were overvalued. To further fund these projects, the company also secured a USD 2.5 million loan facility from a company based in the British Virgin Islands, according to Business World.
Modest changes in Harbor Star’s revenues could have a marked impact on the company’s operating profit, further underscoring the need for the company to smartly manage its expansion and business diversification efforts. In 2016 and 2015, Harbor Star exhibited a relatively high degree of operating leverage (DOL)—the amount of fixed costs compared to variable costs—which we defined as the percent change in earnings before interest and tax (EBIT) divided by the percent change in sales. For 2016, its DOL was approximately 23%, indicating that a 10% change in sales would impact operating income by 23%; in 2015, its DOL was approximately 47%, indicating that a 10% change in sales would lead to a 47% change in operating income.[5]
VALUATION
Thesis
Two primary macroeconomic trends—increased trade and GDP growth throughout Asia—will lead to increased shipping and thus greater demand for harbor assistance services, presenting Harbor Star a great opportunity to expand its operations in the Philippines and throughout Southeast Asia. We assess protectionist fears will be overstated and countries, particularly those in emerging markets, will continue to liberalize their economies and enact new trade agreements. For the Philippines, completion and passage of new trade agreements, such as the Regional Comprehensive Economic Partnership (RCEP) and, possibly, an amended Trans-Pacific Partnership (TPP), will further integrate the Philippines with other Asian economies, further cementing the region’s already high trade-openness ratio. Additionally, the strong GDP growth expected in Southeast Asia and the Philippines, bolstered by the significant infrastructure projects underway in several of these countries, also will lead to increased trade.
Forecasting revenue
Philippines-based Revenue: We apply a two-step regression approach to forecast Philippines-based revenue, incorporating the growth catalysts we previously identified. In the first step, we use IMF estimates of Global GDP (in USD) and Philippine GDP (in USD) to forecast cargo throughput—the volume of imported cargo—at Philippine ports. We assess cargo throughput is a function of GDP because trade, and thus cargo throughput, should increase as GDP increases. Using data from 2005-2016, we run a multiple regression with global and Philippine GDP as independent variables and cargo throughput as the dependent variable.[6] This produces the following R-square, t-statistic, and regression equation:
R-square: 0.95
T-statistic (intercept): 6.87
T-statistic (Global GDP): -4.30
T-statistic (Philippine GDP): 7.44
Equation: Cargo Throughput = 225,920,384.96698 – 3,796.0249 * Global GDP (USD) + 986,567.6985 * Philippine GDP (USD)
Incorporating IMF estimates for global and Philippine GDP (in USD) from 2017-2022 into this equation, we obtain estimates for total cargo throughput at Philippine ports.
Cargo throughput estimate as a function of global and Philippine GDP in USD
Year |
Global GDP (USD, billions) |
Philippines GDP (USD, billions) |
Estimated cargo throughput at Philippine ports |
2017 |
77,988 |
330 |
255,162,693 |
2018 |
81,962 |
372 |
281,575,376 |
2019 |
86,137 |
419 |
311,924,195 |
2020 |
90,562 |
472 |
347,370,590 |
2021 |
95,172 |
526 |
383,133,813 |
2022 |
99,956 |
579 |
417,998,594 |
In the second step, we use these estimates for cargo throughput to forecast revenues for Harbor Star. We assess that Harbor Star revenue is a function of cargo throughput because the amount of cargo that enters Philippine ports should correlate with the number of ships that enter Philippine ports and require Harbor Star’s services. Using data from 2011-2016—the years we have revenue data for Harbor Star—we run a regression with cargo throughput as the independent variable and Harbor Star revenue as the dependent variable.[7] This produces the following R-square, t-statistic, and regression equation:
R-square: 0.94
T-statistic (intercept): -3.38
T-statistic (Cargo Throughput): 7.69
Equation: Revenue = -775,679,185.7925 + 8.36193 * Cargo Throughput
Incorporating the cargo throughput forecasts for 2017-2022 derived from the step-one regression equation, we obtain estimates for Harbor Star’s revenue.
Revenue as function of estimated cargo throughput
Year |
Estimated cargo throughput at Philippine ports |
Harbor Star’s estimated revenues |
2017 |
255,162,693 |
1,357,973,364 |
2018 |
281,575,376 |
1,578,834,360 |
2019 |
311,924,195 |
1,832,609,060 |
2020 |
347,370,590 |
2,129,009,328 |
2021 |
383,133,813 |
2,428,058,892 |
2022 |
417,998,594 |
2,719,595,743 |
Regional and Ancillary Revenue:
In 2016, Harbor Star earned PHP 40,492,250, or approximately USD 810 thousand, operating in Malaysia, and as the company continues to expand into the region we estimate its regional revenues will increase by 10% per year. Separately, we estimate the company’s ancillary revenue, which primarily is derived from the company’s recently-began construction services, will grow at a rolling two-year average.
Forecasting primary expense drivers
Oil Expense (as cost of sales): Similar to our approach in forecasting revenue, we incorporate multiple steps to forecast the company’s fuel expense,[8] taking into account consumption, the price of oil per barrel, and the PHP/USD conversion rate. First, to calculate the number of barrels of oil Harbor Star consumed from 2011-2016, we divide its total fuel and lubricants costs—derived from its annual reports and converted to USD at the rate implied by the IMF’s GDP figures[9]—by the simple average annual USD spot price per barrel of Dated Brent, West Texas Intermediate, and Dubai Fateh, which we obtained from the IMF.
Implied number of barrels of oil consumed
Year |
Fuel and Lubricant Expense (PHP) |
Philippine GDP (PHP, in billions) |
Philippine GDP (USD, in billions) |
Implied PHP/USD conversion rate |
Implied Fuel & Lubricant Expense (USD) |
Average cost per barrel (USD) |
Implied number of barrels consumed |
2011 |
117,021,728 |
9,708 |
224 |
43.31 |
2,701,761 |
104.01 |
25,976 |
2012 |
106,772,390 |
10,561 |
250 |
42.23 |
2,528,426 |
105.01 |
24,079 |
2013 |
134,135,771 |
11,538 |
271 |
42.45 |
3,160,134 |
104.07 |
30,366 |
2014 |
224,590,722 |
12,645 |
284 |
44.4 |
5,058,893 |
96.25 |
52,562 |
2015 |
127,668,490 |
13,307 |
292 |
45.5 |
2,805,725 |
50.79 |
55,238 |
2016 |
140,518,049 |
14,449 |
304 |
47.42 |
2,963,011 |
42.84 |
69,169 |
We then run a regression with the implied number of barrels of oil consumed as the dependent variable and cargo throughput as the independent variable. We assess that the number of barrels of oil used is a function of cargo throughput at Philippine ports because cargo throughput should reflect the demand for Harbor Star’s services, which will impact its fuel consumption. These regression inputs produce the following R-square, t-statistic, and regression equation:
R-square: 0.90
T-statistic (intercept): -4.25
T-statistic (Cargo Throughput): 5.93
Equation: Implied number of barrels consumed = -110,611.31246 + 0.00073 * Cargo Throughput
Incorporating the cargo throughput forecasts for 2017-2022 derived from the regression equation described in step-one of the Philippine revenue forecast, we obtain estimates for Harbor Star’s implied number of barrels of oil consumed. We then multiply the forecasted oil consumption by the IMF’s forecasted average price of oil per barrel.
Estimated fuel costs as function of consumption, price per barrel, and PHP/USD conversion rate
Year |
Forecasted consumption |
IMF forecasted average price per barrel of oil (USD) |
Estimated fuel and lubricant costs (USD) |
Philippine GDP (PHP, in billions) |
Philippine GDP (USD, in billions) |
Implied PHP/USD conversion rate |
Estimated fuel and lubricant costs (PHP) |
2017 |
75,973 |
55.24 |
4,196,365 |
15,991 |
330 |
48.50 |
203,523,561 |
2018 |
95,287 |
55.06 |
5,246,209 |
17,659 |
372 |
47.50 |
249,194,786 |
2019 |
117,479 |
54.15 |
6,361,254 |
19,465 |
419 |
46.50 |
295,798,189 |
2020 |
143,399 |
53.96 |
7,737,508 |
21,456 |
472 |
45.50 |
352,056,419 |
2021 |
169,550 |
54.39 |
9,221,151 |
23,650 |
526 |
45.00 |
414,951,848 |
2022 |
195,044 |
55.21 |
10,768,016 |
26,068 |
579 |
45.00 |
484,560,565 |
Wage Expense (as cost of sales): For wage expenses associated with the cost of sales, we take the percent of wages to total revenues in 2016, which is 13.93%, and add 0.5% per year from 2017-2021. We add 0.5% per year in wage expense because the employees associated with the cost of sales probably are those most in demand from foreign companies and therefore most likely to command greater salaries.
Capital Expenditure and Depreciation Schedule
We grow capital expenditures—we consider both PPE valued at its cost and revalued amount—as a percent of revenue. For PPE at its revalued amount this reflects a capital expenditure growth rate of 7.76%, and for the PPE listed at cost this reflects a capital expenditure growth rate of 7.95%. We do not incorporate into our capital expenditure Habor Star’s intent to spend PHP 1 billion in 2017, according to the company’s 2016 annual report.
We estimate depreciation costs as a percent of PPE, which reflects 12.24% of PPE listed at the revalued amount and 13.90% of the PPE listed at cost.
Cost of Capital Calculations and Target Price
Beta: To calculate Harbor Star’s beta, we use the unlevered beta for the shipbuilding and marine sector, which is 0.83, according to Aswath Damodaran, and adjust the beta to account for the Philippine tax rate and Harbor Star’s debt to equity ratio.[10] This produces a levered beta of 1.15.
Risk free rate: To calculate the risk-free rate for the Philippines, we used the 10 year Philippine government bond denominated in PHP, which was yielding 4.845% as of 18 May, according to Asian Bonds Online.
Market premium: To calculate the market premium, we take the geometric average of US stock returns over treasury bonds from 1926 to 2000, which is 5.59%, according to Damodaran, and then add the Philippine country risk premium. To calculate this premium, we take the one year standard deviation of the Philippine Stock Exchange index (24 May 2016 – 22 May 2017) and divide it by the one year standard deviation of the 10 year Philippine bond denominated in PHP. We then multiply this by the Philippine default spread, which is 2.20%, according to Damodaran. This yields a country premium of 1.53%, which produces a total market premium of 7.12%
Cost of equity and debt: Applying the CAPM model to the cost of equity, we obtain a cost of equity of 13%. For cost of debt, we use the range of Harbor Star’s interest cost—not the interest expense from the income statement—which for 2016 was 4.5% to 13.65%, and then apply the average rate as the cost of debt. This yields a cost of debt of 9.08%.
Total debt and equity: For 2016, Harbor Star’s total debt is 844,296,429, which we straight-line for our valuation. Harbor Star has a negligible value of operating leases, according to its 2016 annual report, and therefore we do not capitalize these leases and add them to the debt level. However, we do add the financing leases to debt. Harbor Star’s total equity available to owners in 2016 is 1,553,485,603.
Weighted average cost of capital[11]: Incorporating the figures above, we obtain a cost of capital of 10.66%.
Terminal growth: We apply a terminal growth rate of 3%.
Target price: Based on our analysis, assumptions, and valuation approach—which could be flawed—we arrive at a price target of PHP 4.54. This price target is 57% higher than Harbor Star’s closing price of 2.89 on 22 May 2017 and represents an EBITDA multiple of approximately 3.25.
Table of cost of capital calculations
Beta |
1.15 |
Risk free rate |
4.845% |
Market premium for mature market |
5.59% |
Country premium |
1.53% |
Philippine market premium |
7.12% |
Total debt |
844,296,429 |
Total equity |
1,553,485,603 |
Weighted average cost of capital |
10.66% |
Terminal growth |
3% |
Target price |
PHP 4.54 |
INCOME STATEMENT(Philippine Peso) |
||||||||||
|
|
2012A |
2013A |
2014A |
2015A |
2016A |
2017E |
2018E |
2019E |
2020E |
2021E |
12/31/12 |
12/31/13 |
12/31/14 |
12/31/15 |
12/31/16 |
12/31/17 |
12/31/18 |
12/31/19 |
12/31/20 |
12/31/21 |
|
Service Income |
807,263,889 |
898,695,497 |
1,103,857,628 |
1,040,243,517 |
1,360,830,025 |
1,437,562,312 |
1,674,086,765 |
1,927,156,373 |
2,231,748,486 |
2,535,325,356 |
Cost of sales |
(416,427,848) |
(577,199,936) |
(755,382,776) |
(694,558,002) |
(956,581,038) |
(975,117,597) |
(1,110,191,218) |
(1,259,525,976) |
(1,445,080,589) |
(1,644,730,528) |
Gross profit |
390,836,041 |
321,495,561 |
348,474,852 |
345,685,515 |
404,248,987 |
462,444,714 |
563,895,547 |
667,630,397 |
786,667,897 |
890,594,829 |
General and administration expense |
(134,295,122) |
(128,512,785) |
(172,420,614) |
(208,490,115) |
(205,556,511) |
(234,907,032) |
(273,556,665) |
(314,909,885) |
(364,682,218) |
(414,288,653) |
Other income (expenses), net |
(10,189,622) |
7,420,874 |
29,205,041 |
6,583,653 |
22,884,747 |
22,884,747 |
22,884,747 |
22,884,747 |
22,884,747 |
22,884,747 |
Operating profit |
246,351,297 |
200,403,650 |
205,259,279 |
143,779,053 |
221,577,223 |
250,422,430 |
313,223,628 |
375,605,258 |
444,870,426 |
499,190,923 |
Interest expense |
(36,473,649) |
(44,577,929) |
(23,766,686) |
(36,821,370) |
(40,641,488) |
(40,641,488) |
(40,641,488) |
(40,641,488) |
(40,641,488) |
(40,641,488) |
Foreign exchange loss on borrowing |
0 |
0 |
(3,032,874) |
(1,396,810) |
(2,086,027) |
0 |
0 |
0 |
0 |
0 |
Share in profit / (loss) of associates |
1,272,332 |
(387,216) |
542,703 |
969,982 |
1,558,856 |
1,558,856 |
1,558,856 |
1,558,856 |
1,558,856 |
1,558,856 |
Profit before income tax |
211,149,980 |
155,438,505 |
179,002,422 |
106,530,855 |
180,408,564 |
211,339,798 |
274,140,996 |
336,522,626 |
405,787,794 |
460,108,291 |
Income tax expense |
(62,863,053) |
(46,956,742) |
(55,344,806) |
(38,813,405) |
(79,521,348) |
(63,401,939) |
(82,242,299) |
(100,956,788) |
(121,736,338) |
(138,032,487) |
Net income |
148,286,927 |
108,481,763 |
123,657,616 |
67,717,450 |
100,887,216 |
147,937,858 |
191,898,698 |
235,565,838 |
284,051,456 |
322,075,804 |
Remeasurements on retirement benefits, net of tax |
(5,979,837) |
944,790 |
(556,810) |
(5,154,601) |
4,014,924 |
0 |
0 |
0 |
0 |
0 |
Share in other comprehensive income of associates |
0 |
0 |
0 |
0 |
148,000 |
0 |
0 |
0 |
0 |
0 |
Fair-value loss on available for sale security |
0 |
0 |
(160,000) |
0 |
0 |
0 |
0 |
0 |
0 |
0 |
Total comprehensive income |
142,307,090 |
109,426,553 |
122,940,806 |
62,562,849 |
105,050,140 |
147,937,858 |
191,898,698 |
235,565,838 |
284,051,456 |
322,075,804 |
Basic shares outstanding |
423,638,580 |
605,238,580 |
605,238,580 |
605,238,580 |
605,238,580 |
605,238,580 |
605,238,580 |
605,238,580 |
605,238,580 |
605,238,580 |
Impact of dilutive securities |
0 |
0 |
0 |
0 |
0 |
0 |
0 |
0 |
0 |
0 |
Diluted shares outstanding |
423,638,580 |
605,238,580 |
605,238,580 |
605,238,580 |
605,238,580 |
605,238,580 |
605,238,580 |
605,238,580 |
605,238,580 |
605,238,580 |
EBITDA RECONCILIATION |
||||||||||
|
|
2012A |
2013A |
2014A |
2015A |
2016A |
2017E |
2018E |
2019E |
2020E |
2021E |
EBIT |
97,821,473 |
83,934,856 |
148,653,928 |
171,668,745 |
164,915,023 |
194,265,544 |
232,915,177 |
274,268,397 |
324,040,730 |
373,647,165 |
Depreciation & Amortization |
101,150,653 |
165,899,386 |
211,454,091 |
233,389,097 |
262,990,283 |
0 |
0 |
0 |
0 |
0 |
Stock based compensation |
0 |
0 |
0 |
0 |
0 |
0 |
0 |
0 |
0 |
0 |
EBITDA |
198,972,126 |
249,834,242 |
360,108,019 |
405,057,842 |
427,905,306 |
194,265,544 |
232,915,177 |
274,268,397 |
324,040,730 |
373,647,165 |
EBITDA, less SBC |
198,972,126 |
249,834,242 |
360,108,019 |
405,057,842 |
427,905,306 |
194,265,544 |
232,915,177 |
274,268,397 |
324,040,730 |
373,647,165 |
RATIOS |
||||||||||
2012A |
2013A |
2014A |
2015A |
2016A |
2017E |
2018E |
2019E |
2020E |
2021E |
|
Gross profit margin |
48.41% |
35.77% |
31.57% |
33.23% |
29.71% |
32.17% |
33.68% |
34.64% |
35.25% |
35.13% |
Operating margin |
30.52% |
22.30% |
18.59% |
13.82% |
16.28% |
17.42% |
18.71% |
19.49% |
19.93% |
19.69% |
Interest coverage ratio |
6.79x |
4.49x |
8.53x |
3.89x |
5.44x |
6.20x |
7.75x |
9.28x |
10.98x |
12.32x |
Net profit margin |
18.37% |
12.07% |
11.20% |
6.51% |
7.41% |
10.29% |
11.46% |
12.22% |
12.73% |
12.70% |
% growth in revenue |
11.33% |
22.83% |
-5.76% |
30.82% |
5.64% |
16.45% |
15.12% |
15.81% |
13.60% |
|
% growth in EBIT |
-19.23% |
1.38% |
-29.30% |
54.20% |
13.99% |
24.92% |
19.82% |
18.36% |
12.17% |
|
% growth in EBITDA, including SBC |
4.91% |
13.20% |
-9.05% |
28.48% |
9.13% |
11.80% |
11.35% |
12.07% |
9.40% |
|
% growth in EBITDA, less SBC |
4.91% |
13.20% |
-9.05% |
28.48% |
9.13% |
11.80% |
11.35% |
12.07% |
9.40% |
|
% growth in net income |
-26.84% |
13.99% |
-45.24% |
48.98% |
46.64% |
29.72% |
22.76% |
20.58% |
13.39% |
|
Net Debt |
434,348,680 |
326,075,528 |
425,259,117 |
719,543,057 |
754,634,864 |
571,087,971 |
401,956,303 |
226,240,515 |
46,750,320 |
(139,764,014) |
Asset Turnover (Revenue/Total Assets) |
0.48x |
0.45x |
0.49x |
0.40x |
0.49x |
0.49x |
0.53x |
0.56x |
0.59x |
0.61x |
Return on assets (ROA) |
2.94% |
2.89% |
1.39% |
1.88% |
2.61% |
3.16% |
3.57% |
3.92% |
4.04% |
|
Return on book equity (ROE) |
4.98% |
4.61% |
2.39% |
3.37% |
4.55% |
5.34% |
5.86% |
6.25% |
6.26% |
|
Days sales outstanding ((AR/Revenue)*days in period)) |
91.50 |
96.82 |
75.84 |
115.65 |
102.91 |
102.91 |
102.91 |
102.91 |
102.91 |
102.91 |
Accounts Receivable as % of Revenue |
25.07% |
26.53% |
20.78% |
31.69% |
28.19% |
28.19% |
28.19% |
28.19% |
28.19% |
28.19% |
Accounts Payable as % of COGS |
21.67% |
25.07% |
23.95% |
28.53% |
22.56% |
22.56% |
22.56% |
22.56% |
22.56% |
22.56% |
Days payables outstanding ((AP/COGS)*days in period)) |
79.09 |
91.51 |
87.43 |
104.14 |
82.33 |
82.33 |
82.33 |
82.33 |
82.33 |
82.33 |
DCF Valuation |
||||||||||
2012A |
2013A |
2014A |
2015A |
2016A |
2017E |
2018E |
2019E |
2020E |
2021E |
|
12/31/12 |
12/31/13 |
12/31/14 |
12/31/15 |
12/31/16 |
12/31/17 |
12/31/18 |
12/31/19 |
12/31/20 |
12/31/21 |
|
EBITDA |
348,774,282 |
365,915,820 |
414,223,199 |
376,741,322 |
484,040,335 |
528,214,357 |
590,544,977 |
657,553,095 |
736,952,415 |
806,189,411 |
Less: D&A |
101,150,653 |
165,899,386 |
211,454,091 |
233,389,097 |
262,990,283 |
276,233,072 |
275,762,492 |
280,388,981 |
290,523,133 |
305,439,632 |
EBIT |
247,623,629 |
200,016,434 |
202,769,108 |
143,352,225 |
221,050,052 |
251,981,286 |
314,782,484 |
377,164,114 |
446,429,282 |
500,749,779 |
Less: Taxes* |
29.77% |
30.21% |
30.92% |
36.43% |
44.08% |
30.00% |
30.00% |
30.00% |
30.00% |
30.00% |
Tax-adjusted EBIT (NOPAT) |
173,901,731 |
139,593,053 |
140,076,007 |
143,352,225 |
221,050,052 |
251,981,286 |
314,782,485 |
377,164,114 |
312,500,498 |
350,524,845 |
Plus: D&A |
101,150,653 |
165,899,386 |
211,454,091 |
233,389,097 |
262,990,283 |
276,233,072 |
275,762,492 |
280,388,981 |
290,523,133 |
305,439,632 |
Less: Capital Expenditures |
N/A |
373,936,592 |
505,973,202 |
445,699,779 |
360,606,885 |
225,800,102 |
262,951,358 |
302,701,387 |
350,544,134 |
398,227,415 |
Less: Change in working capital |
N/A |
245,386 |
(21,238,000) |
36,882,185 |
80,692,872 |
32,535,791 |
51,831,392 |
54,927,805 |
65,470,888 |
63,634,551 |
Unlevered Free Cash Flow |
(68,689,539) |
(133,205,104) |
(105,840,642) |
42,740,578 |
269,878,465 |
275,762,227 |
299,923,904 |
187,008,609 |
194,102,511 |
|
Discount factor |
0.61 |
1.61 |
2.61 |
3.61 |
4.61 |
|||||
Weighted Average Cost of capital |
10.66% |
10.66% |
10.66% |
10.66% |
10.66% |
|||||
Present value |
253,749,084 |
234,301,910 |
230,280,377 |
129,751,459 |
121,698,886 |
|||||
Perpetuity Approach |
EBITDA-multiple Approach |
|||||||||
Sum of stage 1 present value |
969,781,716 |
Sum of stage 1 present value |
969,781,716 |
|||||||
Unlevered CF in last forecast period |
194,102,511 |
Terminal year EBITDA |
806,189,411 |
|||||||
Terminal growth rate |
3% |
Terminal value EBITDA multiple |
3.25x |
|||||||
UFCF (t+1) |
199,925,587 |
Terminal value |
2,620,115,586 |
|||||||
Terminal value |
2,609,600,929 |
Present value of terminal value |
1,642,766,733 |
|||||||
Present value of terminal value |
1,636,174,226 |
|||||||||
Enterprise value |
2,605,955,942 |
Enterprise value |
2,612,548,448 |
|||||||
Less: Net debt |
(139,764,014) |
Less: Net debt |
(139,764,014) |
|||||||
Equity value |
2,745,719,956 |
Equity Value |
2,752,312,462 |
|||||||
Diluted shares |
605,238,580 |
Diluted shares |
605,238,580 |
|||||||
Price per share |
4.54 |
Price per share |
4.55 |
|||||||
[1] This implies a conversion rate of PHP 50 to USD 1. We apply this rate to all other PHP to USD conversions.
[2] We obtained the number of tugboats exceeding 100 GRT from Harbor Star’s website on 28 April. We note two tugboats, M/T Acturus and M/T Sadr, were listed on the website but not in the company’s 2016 Annual Report. M/T Propus was not listed on the website but was included in the 2016 Annual Report. M/T Propus is not included in our calculation of market share, whereas we did include M/T Acturus and M/T Sadr because their GRT exceeds 100.
[3] We assess Harbor Star is best positioned to pursue business ventures that are consistent with its traditional operations. The archipelagic nature of the Philippines—requiring most trade to enter and depart via ship—and the country’s strong economic growth will continue to provide new growth opportunities for the company, to include possible acquisitions.
[4] Shares closed on 8 May 2017 at PHP 3.06, according to the Philippine Stock Exchange. With 605,238,580 shares outstanding, this implies a market capitalization of PHP 1.852 billion.
[5] To calculate Harbor Star’s degree of operating leverage for 2016 and 2015, we removed the revenues and costs associated with a contract to repair a jetty in Quezon Province because the company’s construction services only began in 2015.
[6] Historical global and Philippine GDP data is sourced to the IMF and cargo throughput data is sourced to the Philippine Port Authority.
[7] We exclude revenue in 2015 and 2016 that is derived from the construction of jetties because we view this revenue as not correlated to cargo throughput.
[8] We exclude fuel and lubricant costs associated with general and administrative (G&A) expenses because we assess these fuel and lubricant expenses are not correlated with cargo throughput. Furthermore, from 2011-2016, Harbor Star’s fuel and lubricant costs associated with G&A comprised, on average, 1.4% of the fuel and lubricant costs associated with cost of sales, suggesting G&A fuel costs are not a primary cost driver.
[9] To calculate the implied PHP/USD conversion rate, we divided each year’s Philippine GDP sum in PHP by the corresponding year’s Philippine GDP sum in USD.
[10] Running a regression of Harbor Star’s percent returns (dependent variable) on the percent returns of the Philippine Stock Exchange index (PSEi) or the S&P 500 (independent variable) yields a low R squared that is not statistically significant. The PSEi is a capitalization-weighted index composed of the 30 highest valued and most liquid stocks that trade on the Philippine Stock Exchange.
[11] We do not account for inflation in our analysis, given the relatively modest inflation the Philippines has experienced since 2000. Based on data provided by the IMF, the Philippines’s average inflation from 2000-2016 was 4.2%, while US inflation over that period averaged 2.2%.