Each week, we provide an overview of the percent returns of the primary indices in Southeast Asia and their currency appreciation or depreciation relative to the US Dollar. We provide this information below. We also capture this information, as well as the trailing four and twelve week movements, and plot the data in charts, which you can find on the “index charts” and “currency charts” pages.
Indices
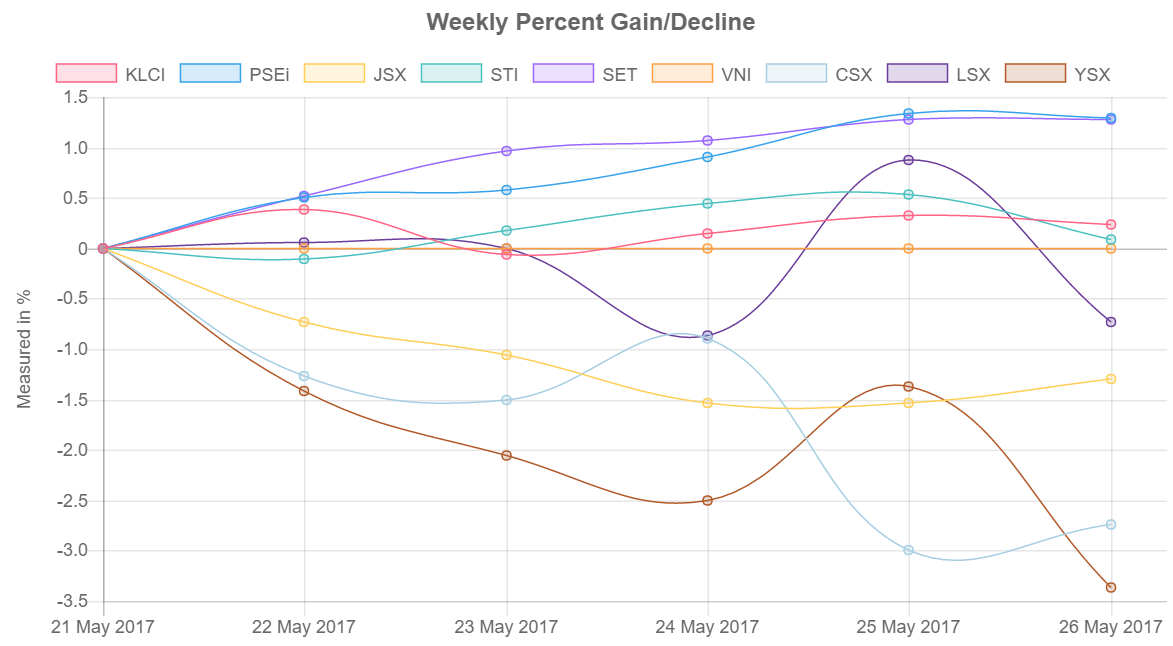
During the week of 22 May, five of the Southeast Asia indices advanced, while four declined. The Philippine Stock Exchange index led all indices, gaining 1.29%, despite Philippine President Rodrigo Duterte instituting martial law on the island of Mindanao in response to terrorism and raising the possibility it could extend to the entire country.
Weekly gains
- Philippine Stock Exchange index (PSEi), 1.29%
- Vietnam All-index (FTFVAS), 1.28%
- Stock Exchange of Thailand (SET), 1.27%
- Kuala Lumpur Composite Index (KLCI), 0.23%
- Singapore’s Straits Times Index (STI), 0.08%
Weekly declines
- Lao Securities Exchange (LSX), -0.73%
- Jakarta Stock Exchange (JSX), -1.30%
- Cambodia Securities Exchange (CSX), -2.74%
- Myanmar’s Myanpix Index (YSX), -3.36%
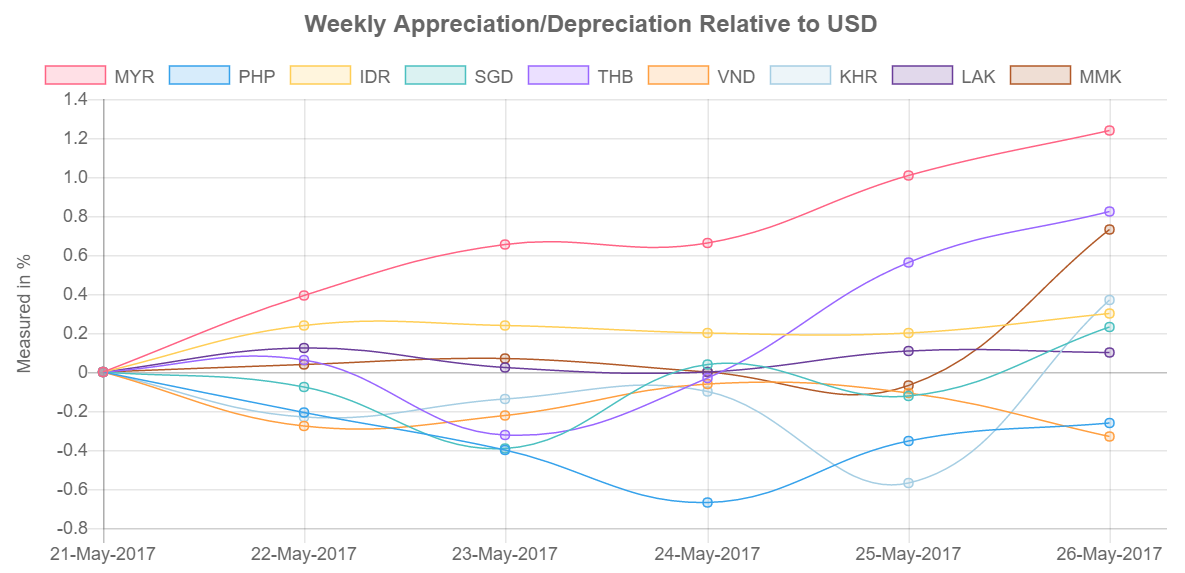
Currencies
During the week of 22 May, seven of the nine primary Southeast Asian currencies appreciated relative to the US Dollar, with the Malaysian Ringgit having the greatest increase and adding to its gains from the previous week. The Philippine Peso and Vietnamese Dong were the only currencies to depreciate relative to the US Dollar.
The Myanmar Kyat reversed its weekly losses when it jumped 0.8% on Friday, giving the currency a 0.73% gain for the week. Nevertheless, the Kyat continues to be the worst of the nine performing currencies; the country’s central bank will replace its deputy governors in July when their terms expire, and they will face pressure to address the declining currency, according to the Myanmar Times.
Weekly appreciations
- Malaysian Ringgit (MYR), 1.24%
- Thai Baht (THB), 0.82%
- Myanmar Kyat (MMK), 0.73%
- Cambodian Riel (KHR), 0.37%
- Indonesian Rupiah (IDR), 0.30%
- Singapore Dollar (SGD), 0.23%
- Lao Kip (LAK), 0.10%
Weekly depreciation
- Philippine Peso (PHP), -0.26%
- Vietnamese Dong (VND), -0.33%