

Each week, we provide an overview of the percent returns of the primary indices in Southeast Asia and their currency appreciation or depreciation relative to the US Dollar. We provide this information below. We also capture this information, as well as the trailing four and twelve week movements, and plot the data in charts, which you can find on the “index charts” and “currency charts” pages.
Indices
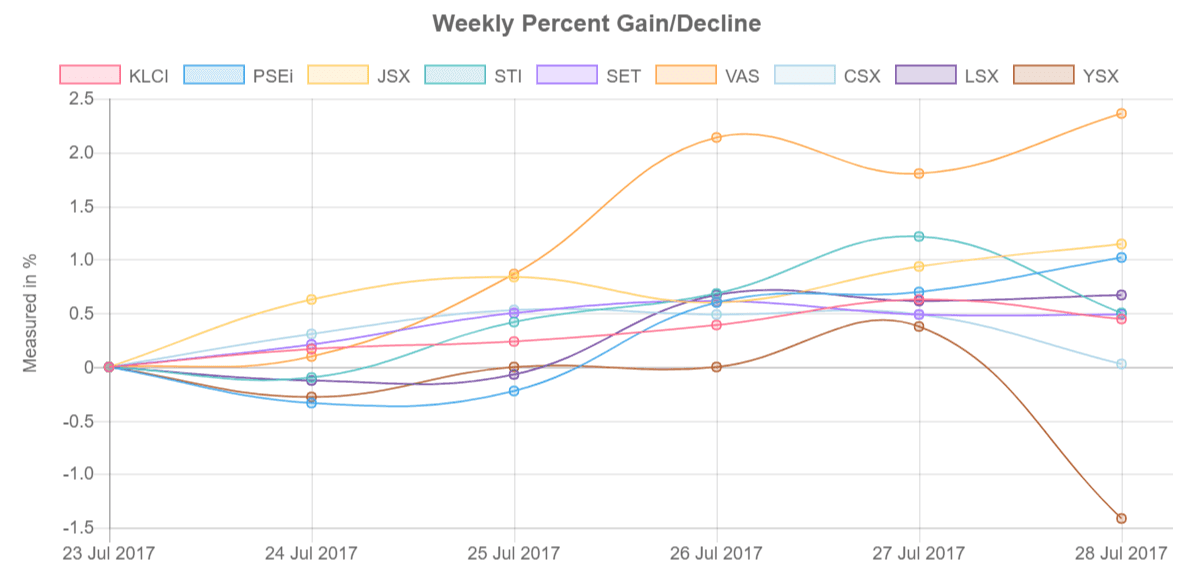
During the week of 24 July, eight of the nine indices in Southeast Asia advanced, with only Myanmar’s Myanpix Index (YSX) declining. The Vietnam All index (FTFVAS) led all gains, rising 2.36% and reversing some of its 3.32% decline the previous week.
Weekly gains
- Vietnam All index (FTFVAS), 2.36%
- Jakarta Stock Exchange (JSX), 1.14%
- Philippine Stock Exchange index (PSEi), 1.02%
- Lao Securities Exchange (LSX), 0.67%
- Singapore’s Straits Times Index (STI), 0.50%
- Stock Exchange of Thailand (SET), 0.48%
- Kuala Lumpur Composite Index (KLCI), 0.45%
- Cambodia Securities Exchange (CSX), 0.02%
Weekly declines
- Myanmar’s Myanpix Index (YSX), -1.41%
Currencies
Six of the nine primary Southeast Asian currencies advanced relative to the US Dollar the week of 24 July, with the Singapore Dollar having the greatest appreciation, rising 0.42%. The Indonesian Rupiah (IDR) had the greatest depreciation, falling 0.11%.
Weekly appreciations
- Singapore Dollar (SGD), 0.42%
- Philippine Peso (PHP), 0.35%
- Thai Baht (THB), 0.24%
- Lao Kip (LAK), 0.09%
- Malaysian Ringgit (MYR), 0.05%
- Cambodian Riel (KHR), 0.00%
Weekly depreciation
- Vietnamese Dong (VND), -0.02%
- Myanmar Kyat (MMK), -0.04%
- Indonesian Rupiah (IDR), -0.11%
